


Infrared Spectroscopy of Polymers
Polymers are large molecules that consist of many repeating units called monomers. They have a wide range of applications in various industries such as plastics, rubber, textiles, coatings and adhesives. In order to ensure the quality and performance of polymer products, it is important to analyse their chemical composition and structure using analytical techniques.
One of the most common and effective methods for polymer analysis is Fourier Transform Infrared Spectroscopy (FTIR).FTIR is based on the principle that molecules vibrate at specific frequencies when they are exposed to infrared light. These vibrations depend on the type of bonds, functional groups, and molecular structure of the material. Some frequencies are absorbed by the material while others are transmitted or reflected. By measuring the intensity of the transmitted or reflected light at different frequencies, an FTIR spectrometer can generate a spectrum that shows the characteristic absorption peaks of the material.
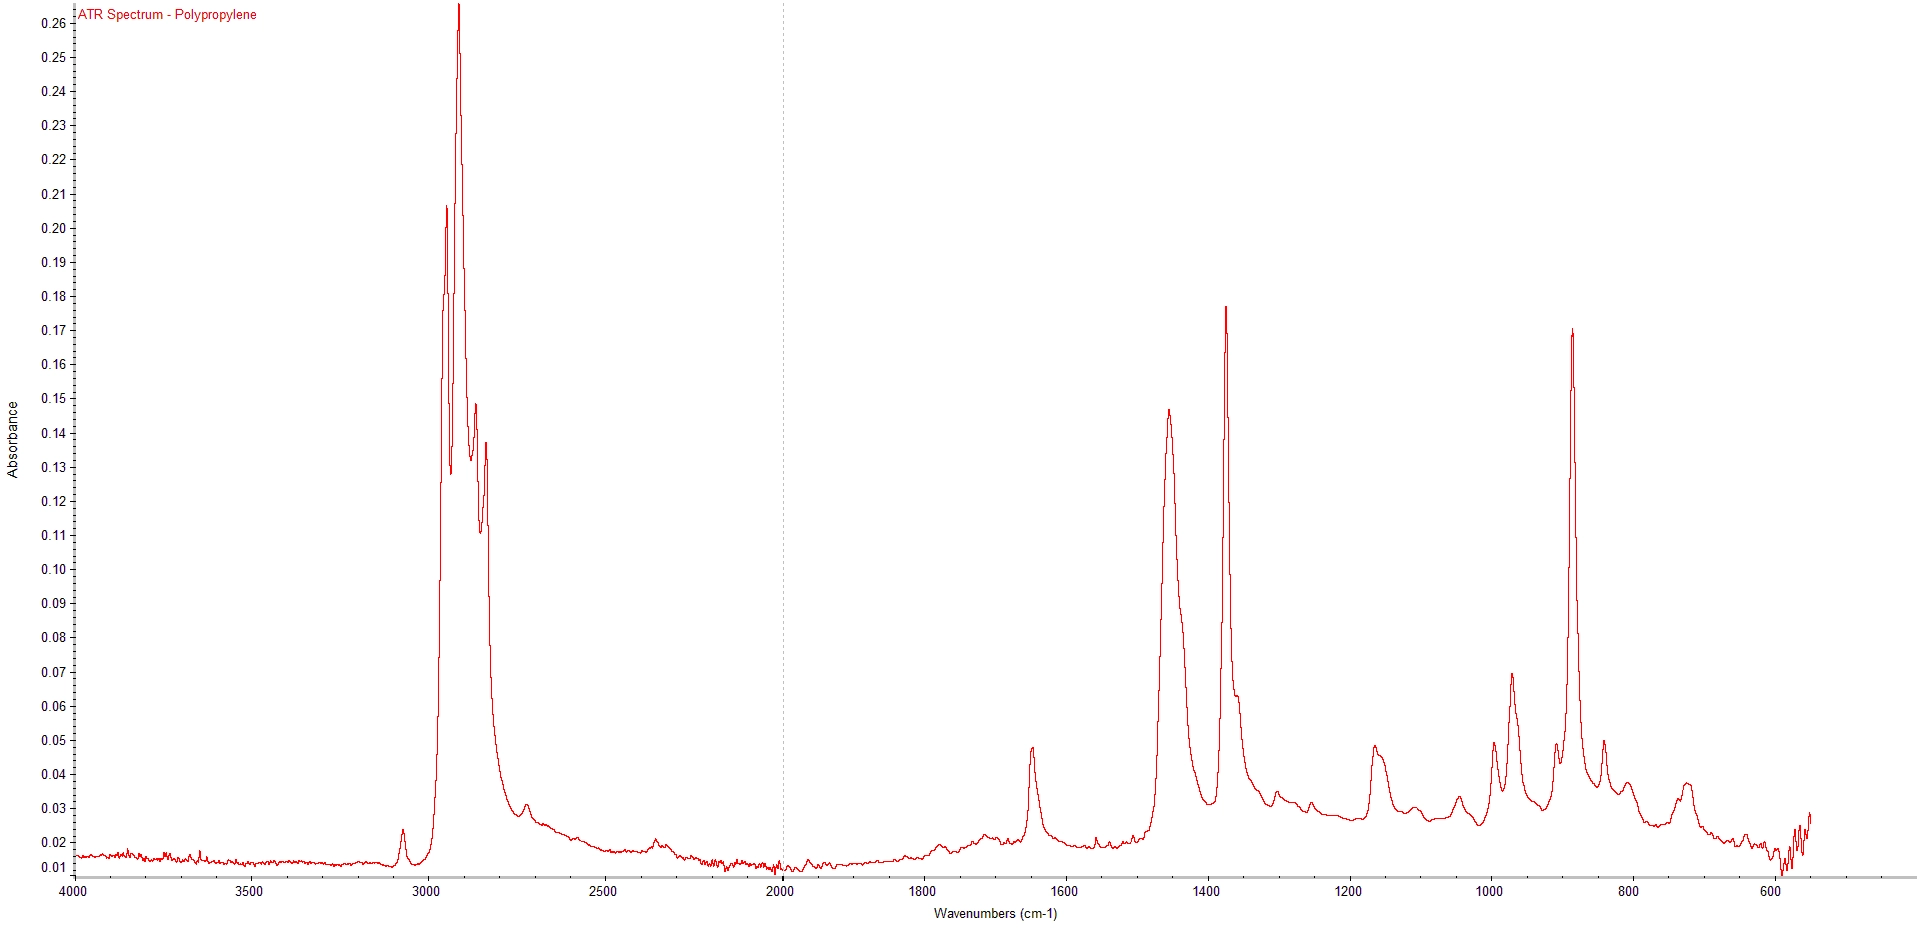
The spectrum can then be compared with reference spectra from known materials or databases to identify the polymer and detect major additives, secondary polymers or contaminants present.
We can record spectra in reflectance from the polymer surface or by transmission through a thin film or section of material. Where necessary, we can use an infrared microscope to record spectra from tiny inclusions, gels, foreign bodies or to scan across sections of laminates or multi-layer components.
Case Study - Infrared Spectroscopy of CPVC Pipe Sample
Following the brittle fracture of a CPVC pipe leading to in-service failure, ipolytech used a number of FT-IR techniques to support the investigation.
Initially, infrared spectra were recorded from a new, unused section of pipe. Both internal and external surfaces were analysed by attenuated total reflectance using a diamond ATR sampling accessory. This provides a sampling area of approximately 5 mm x 5 mm.
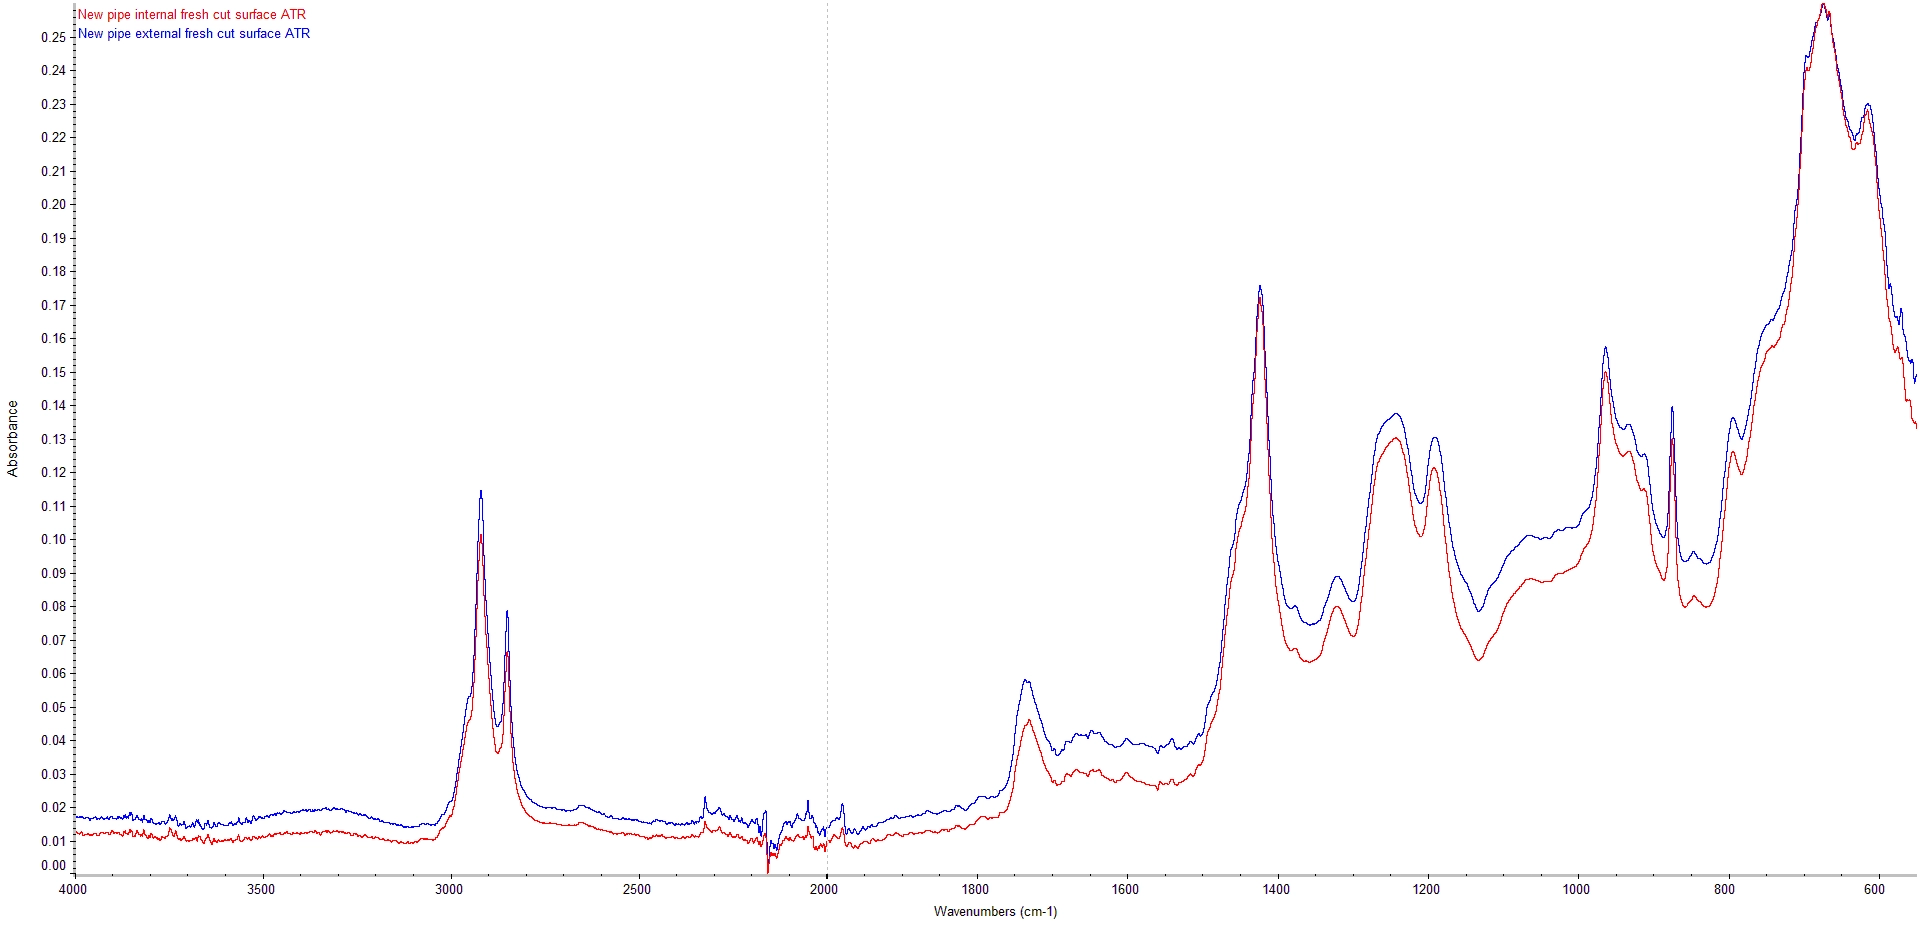
ATR Spectra from Internal and External Surface of New CPVC Pipe
The spectra show characteristic absorption bands associated with a PVC/cPVC material. Also apparent is a strong absorption circa 875 cm-1 which is characteristic of the presence of calcium carbonate within the CPVC formulation and bands at around 965cm-1 and 912 cm-1 consistent with a butadiene impact modifier.
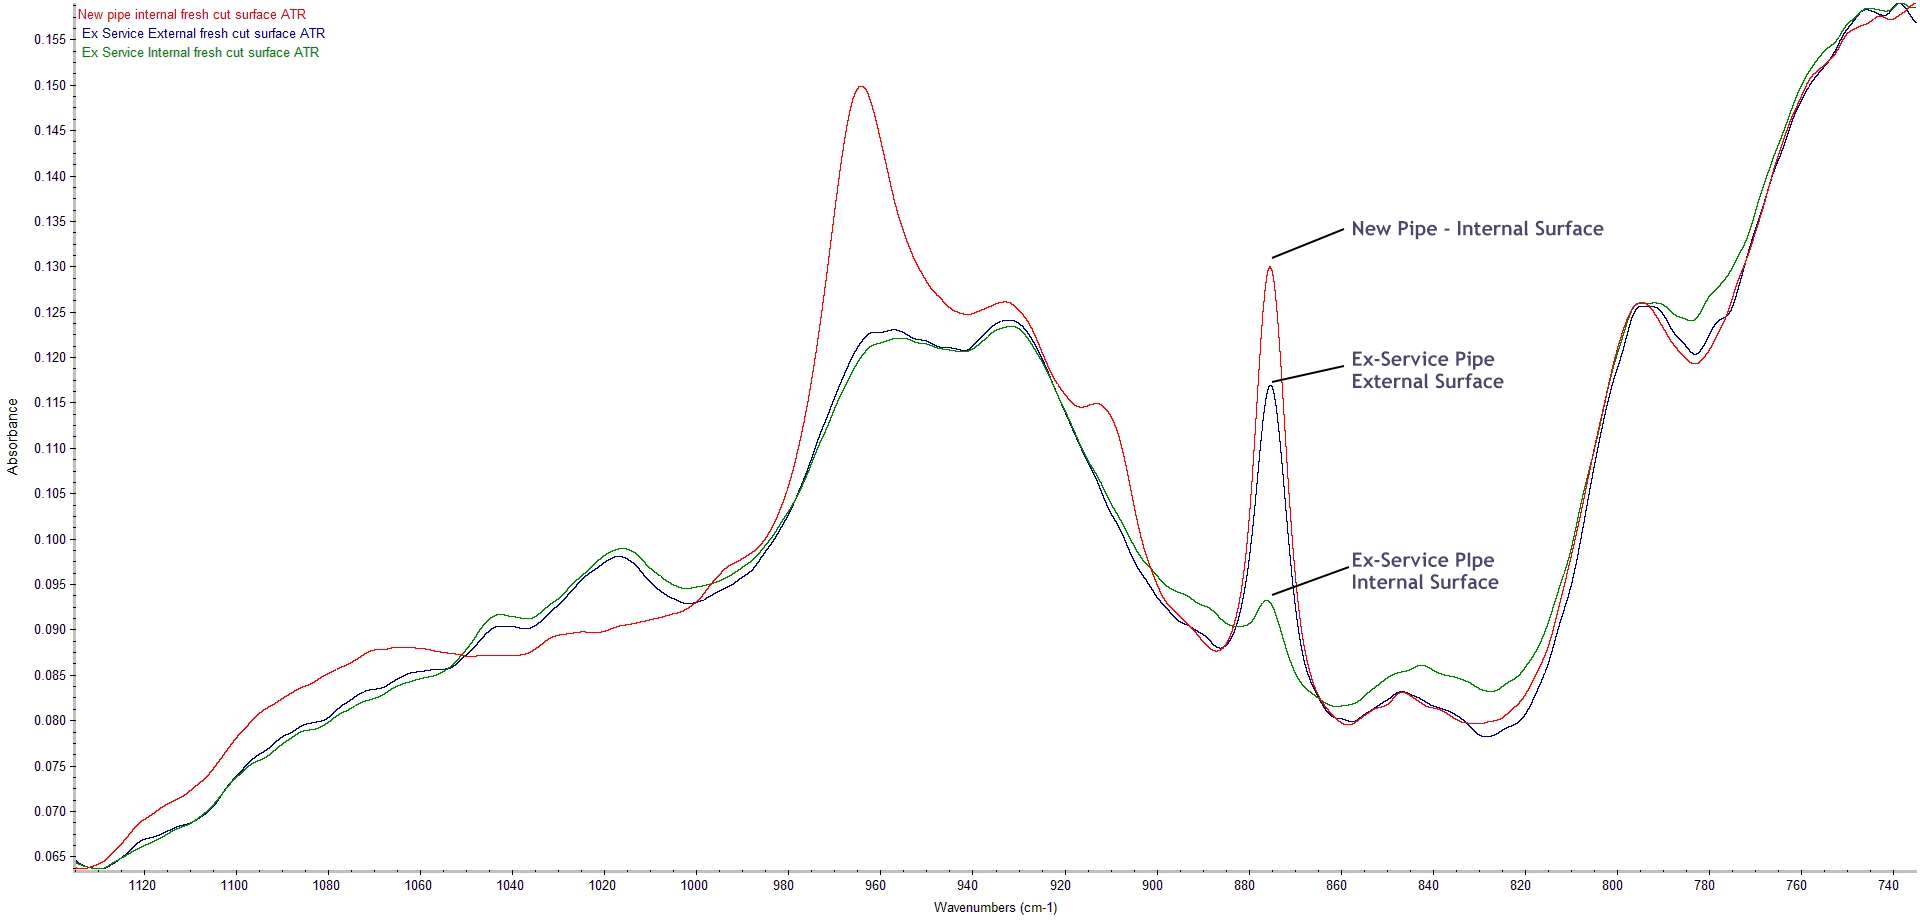
Comparison of butadiene and calcium carbonate peaks in Ex-Service Samples
The spectrum from the external surface of the ex-service pipe showed a slight reduction in the intensity of the 875 cm-1 calcium carbonate absorption but almost complete loss from the internal surface. This indicates an interaction between the calcium carbonate filler and the process fluid which has resulted in loss of calcium carbonate from the internal surface of the pipe.
The butadiene absorption band at 912 cm-1 is missing from the spectra for material from both the internal and external surfaces of the of the ex-service samples and the 965cm-1 peak is further reduced relative to levels in the new pipe. This indicates that the butadiene in the samples has been degraded throughout the sample thickness.
inspection of the fracture surface of an ex-service pipe with an optical microscope, showed two distinct surface structures with the outer 3.4 mm of pipe having a solid appearance whilst the inner material had a foamed/voided appearance.
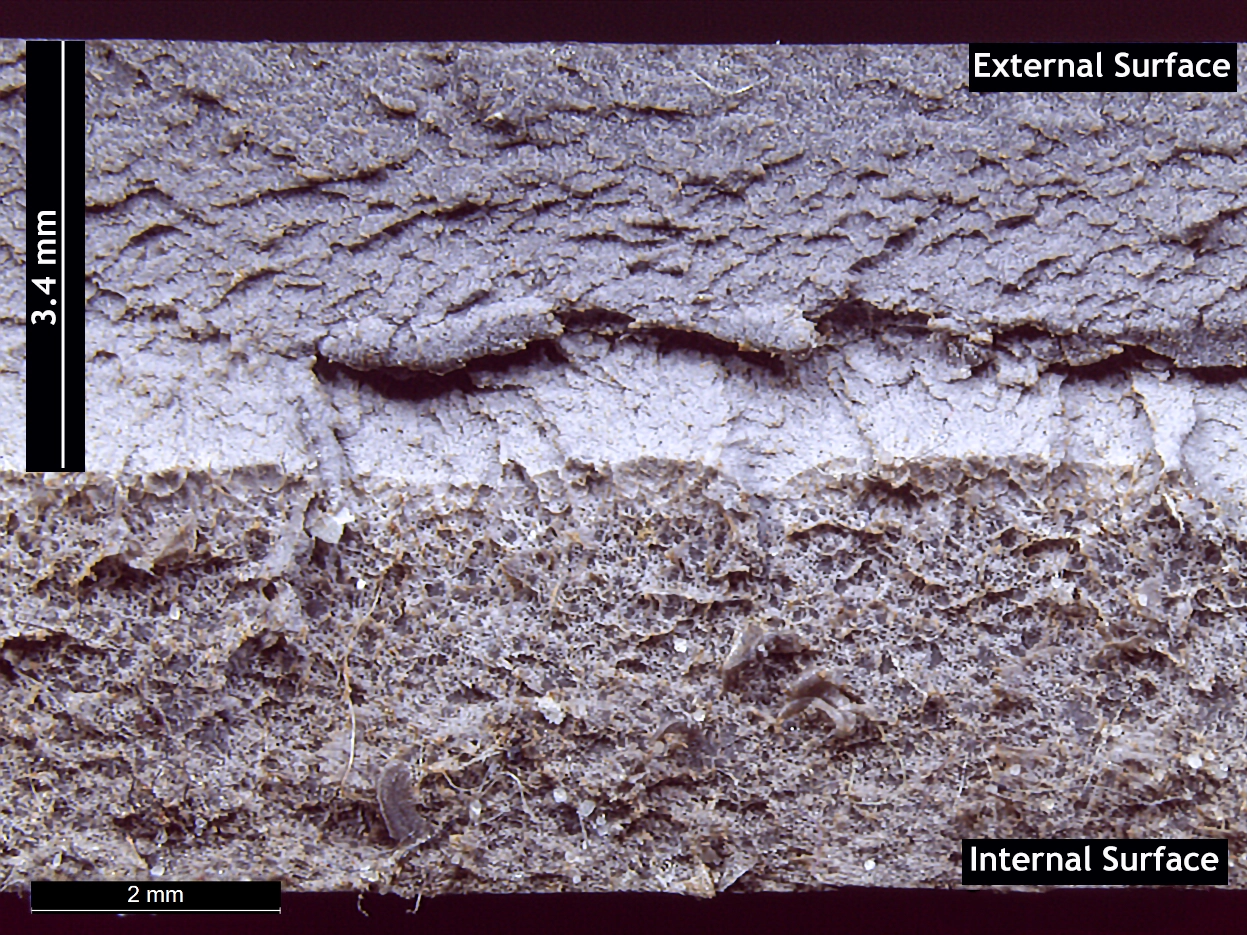
Fracture surface of CPVC pipe showing voided/foamed structure on internal surface.
To determine whether the structure observed on the fracture surface was due to the calcium carbonate loss seen on the initial infrared analysis, spectra were recorded through the thickness of an ex-service sample using a Nicolet iN10 MX infrared microscope with a Germanium ATR crystal. The sample was scanned in 50 micon steps. The intensity of the 875cm-1 calcium carbonate peak was mapped along the surface of the section; more intense absorptions are shown in red/yellow, lower intensity absorptions are shown in blue.
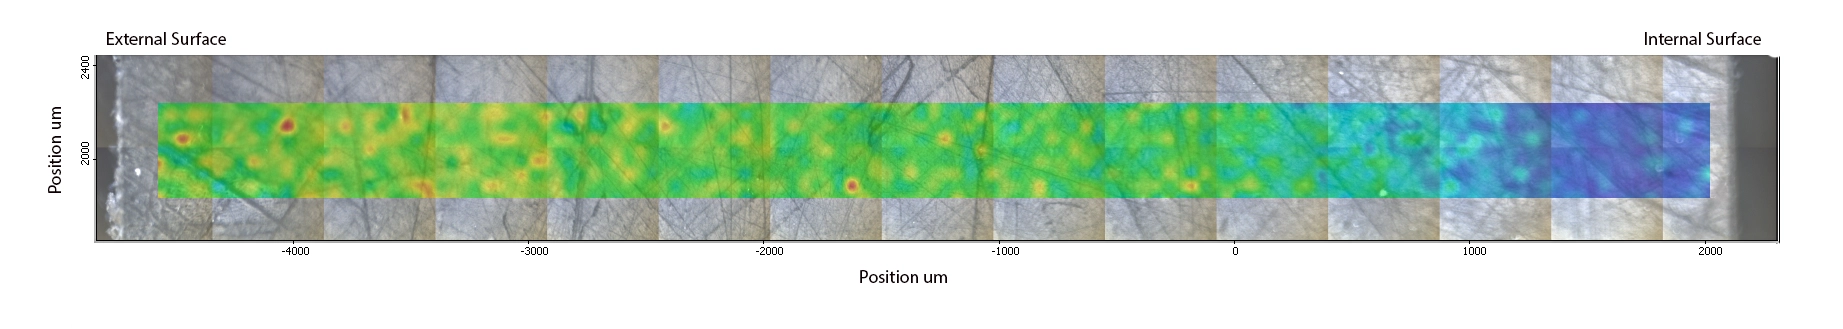
Chemical map of calcium carbonate intensity
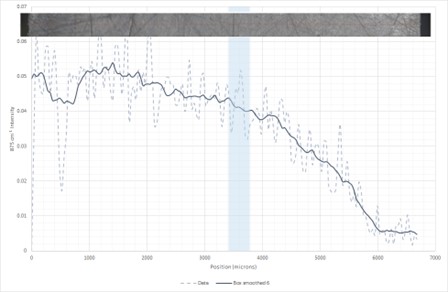
Calcium carbonate intensity through wall thickness
The shaded box indicates the 3.4-3.8 mm from the external surface equivalent to the onset of voiding noted in samples. Whilst there appears to be some reduction in calcium carbonate intensity prior to this position the reduction becomes s more significant towards the internal surface beyond this position. This supports the hypothesis that the voiding seen on the internal source of the pipes is due to reaction of calcium carbonate with the process fluids in the pipe . The resultant structure has significantly weakened the material.
The analysis and chemical maps supports the hypothesis that the voiding seen on the internal source of the pipes is due to reaction of calcium carbonate with the process fluids in the pipe . The resultant structure has significantly weakened the material.